

2016 SPX Annual – 2038/2277/1810/2238
Jan SPX Monthly 2251/2300/2245/2278
Feb SPX Monthly 2285/2371/2271/2363
Mar SPX Monthly 2380/2400/2322/2362
Apr SPX Monthly 2362/2398/2328/2384
May SPX Monthly 2388/2404/2367/2373 David Larew studyofcycles.blogspot.com
 7:15 – ES 2388, 48.82, 1245, 16.92, 11.60, 97.84, 2.292%
11:30 – 2373, 49.35, 1256, 16.90, 13.43, 97.51, 2.249%
S – 2357, 48.97, 1259, 16.88, 15.05, 97.41, 2.223%
ETF leaders Will the Don and the Left wing media war finally gain traction at the market’s expense? Close above 2378 opens door to 2400+ ? Close below opens door to 2300. Sell in May and go away? No one said you had to sell May 1st. Sell in June, avoid the swoon…Pattern reminds me of TJ’s X wave (Traders Corner below), burn time, burn premium, sideways to down.


 …
…
 I have 5 down. Viewing the entire pattern from Jan to July 2016 as W1 up and the decline from July to Dec as W2 back. If correct, that puts us in w3 of W3 with recapture weekly MA200. The GDX pattern of a large inverse H&S projects to 32 if triggered. Robert Cote
Bradley Siderograph 2017 turn dates
 Traders corner
50/200 SMA cross: Buy when the seven-month seasonal pattern is bullish and the 50-day SMA is above the 200-day SMA. Sell when the seven-month seasonal pattern is bearish and the 50-day SMA is below the 200-day SMA.
3 bar reversal candlestick pattern – “At a trading top, it will look like this: Bar #1 is an up bar. Bar #2 is a down bar, and the high of Bar #2 is higher than the close of Bar #1. Bar #3 is a down bar, and the close of Bar #3 is lower than the open of Bar #1. The inverse occurs at trading bottoms. These can also occur in the middle of a trending move, after a counter trend wave is complete, and when that happens, it’s signaling the continuation of the current trend. This pattern occurs on all time frames, but I have found that the hourly gives the best risk/reward setup. At a trading top, the trading strategy is to go short at the close of Bar #3, and place a stop one tick above the high of Bar #2.” AAH Michael
Larry Conner’s trading model: P> 200 DMA, buy close when RSI(2) <5, sell P> 5 DMA.
EMA cross: “Take a position when the 13/34 EMA crosses on the 15, then another on the 1 hour, finally, fully positioned on the 2 hour. When in doubt, I wait for the daily. Create a disciplined system and stick with it, adjusting as needed along the way.” B Seagle
Rules based system: “With a rules based system, you don’t have to know what the market will do, or any stock will do, know what you will do under any outcome…Consistently following price and technical levels with a disciplined, objective process will generate more profits than prediction ever will…I put it all out there. Some trades work, some don’t. Nothing wrong with being wrong, I just don’t stay wrong for long.” LMT978
Trader Joe X Wave: 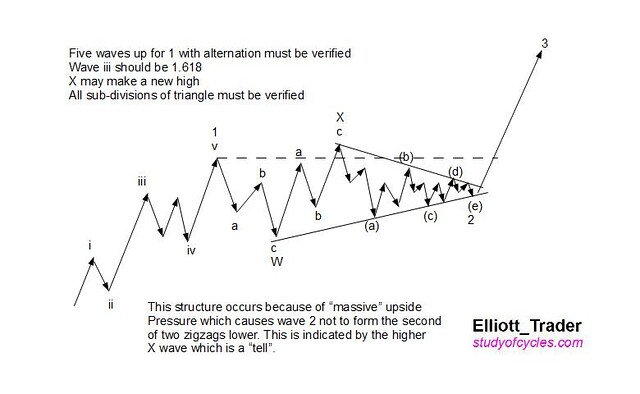
TJ Diagonals: If you see a little “Contracting Leading Diagonal” at the beginning of the wave? That tells you “something very powerful is ahead”. But if you don’t care to learn the five simple patterns, you will never discover the power of the wave following. Diagonals happen because the market is “winding up for the pitch”. It has to “gather energy” to pop! And we all know what follows that wave!
Gary Smith 1-2-3-4 set up: new high consolidate for three days, buy day four over day three high.
Coppock Curve – designed by the late E.S. Coppock, to identify major lows. The signal he developed was to wait for the indicator to fall below zero and then turn up; other than that, he concluded that the indicator was of little use. M Pring
“It is a cardinal principal of stock manipulation to put up a stock in order to sell it.” JL
 Mr. Grey struggling with 18; recapture weekly 200MA
![]()
Go Fish
“The key to speculation is observation to determine how a market reacts to a possible time/price harmonic” Jeff Cooper
“See both sides, opportunity is more easily made up than losses” Todd Harrison
All content for education, not trading advice; do your own due diligence. FD – may have positions in securities mentioned.
