

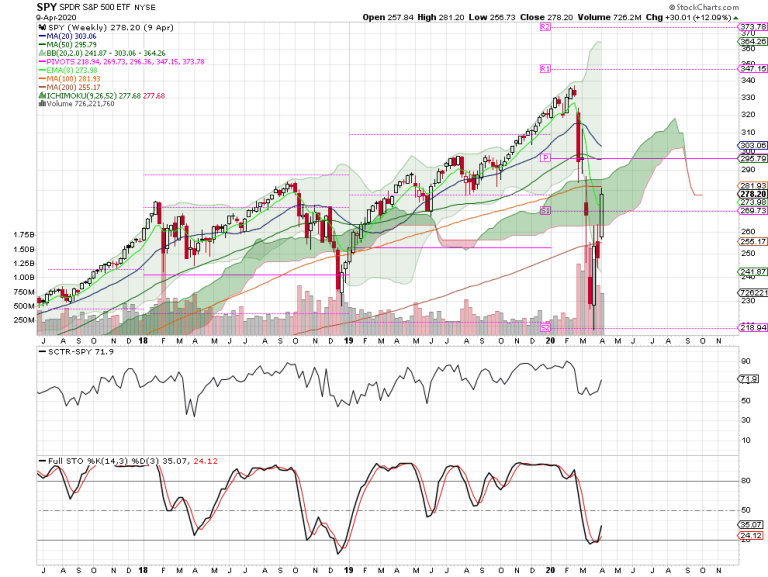
Apr SPX Monthly 2498/2818/2447/2789
Mar SPX Monthly 2974/3090/2191/2584
Feb SPX Monthly 3235/3385/2855/2954
Jan SPX Monthly 3244/3337/3214/3225
2019 SPX Annual 2498/3247/2443/3230
2018 SPX Annual 2683/2940/2346/2506

On the Sq9: 2772 is square; 2825 opposite

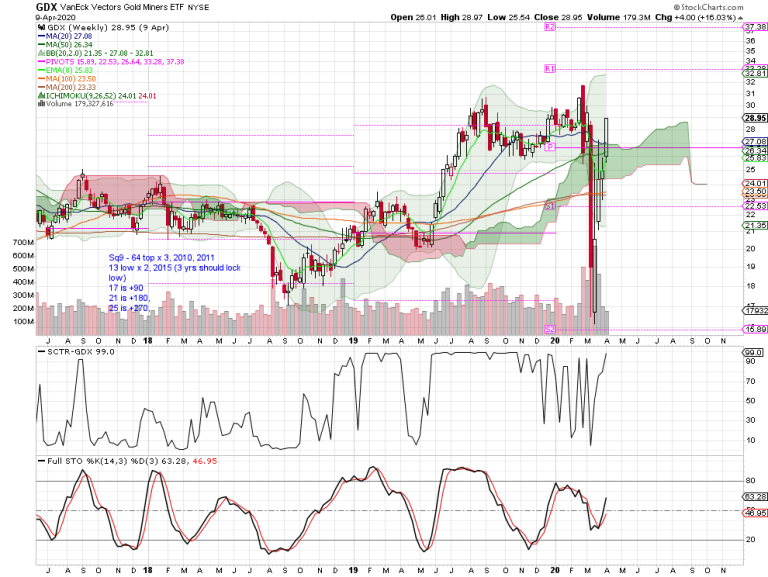
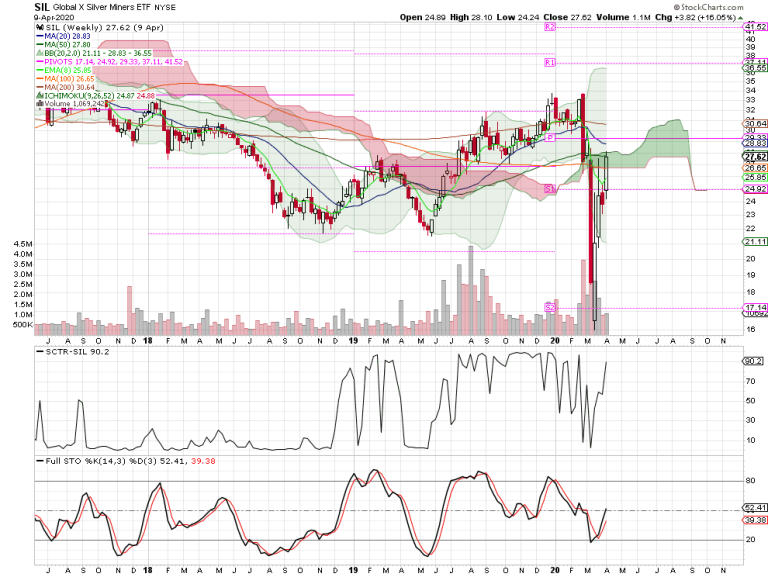
 Gold – I have been counting this as a 1,2 1,2 with 3 on deck from a macro view (1,2 from micro). Counts best as a WXY as 2 back (see 321gold). 2015 low at 13 may be locked, 3 year rule. W1 and W2 appear equal time wise, and the pattern strikes the expected retracement (.318). What seemed a drawn out 1,2 pattern may be designed to throw us off. Robert Cote

Bradley Siderograph 2018 turn dates
 Traders corner
50/200 SMA cross: Buy when the seven-month seasonal pattern is bullish and the 50-day SMA is above the 200-day SMA. Sell when the seven-month seasonal pattern is bearish and the 50-day SMA is below the 200-day SMA.
3 bar reversal candlestick pattern: “At a trading top, it will look like this: Bar #1 is an up bar. Bar #2 is a down bar, and the high of Bar #2 is higher than the close of Bar #1. Bar #3 is a down bar, and the close of Bar #3 is lower than the open of Bar #1. The inverse occurs at trading bottoms. These can also occur in the middle of a trending move, after a counter trend wave is complete, and when that happens, it’s signaling the continuation of the current trend. This pattern occurs on all time frames, but I have found that the hourly gives the best risk/reward setup. At a trading top, the trading strategy is to go short at the close of Bar #3, and place a stop one tick above the high of Bar #2.” AAH Michael (note: Coops +1 -2 buy signal, same structure, different resolution)
EMA cross: “Take a position when the 13/34 EMA crosses on the 15, then another on the 1 hour, finally, fully positioned on the 2 hour. When in doubt, I wait for the daily. Create a disciplined system and stick with it, adjusting as needed along the way.” B Seagle
Rules based system: “With a rules based system, you don’t have to know what the market will do, or any stock will do, know what you will do under any outcome…Consistently following price and technical levels with a disciplined, objective process will generate more profits than prediction ever will…I put it all out there. Some trades work, some don’t. Nothing wrong with being wrong, I just don’t stay wrong for long…Most Traders/Investors with very strong opinions, biases or convictions, have a very difficult time accepting when a trade runs them over.” LMT978
Control the mind and … “I want to begin by saying that a trader has one thing to control just look in the mirror its that simple you can draw all the lines and read all the news you want but in the end if you are not in the Zone you will struggle. When not in the Zone you must decide whether to run and hide or taper down your size and tighten risk in general until you can again feel more confident and start trading your system well gain… My approach initially was to reduce size and tighten risk while a muddled through that time-period. Then one day I woke up and realized that I had inadvertently or unknowingly changed my risk/stop loss methods and had essentially sabotaged my technique resulting in lack luster performance. The day I realized my errors was like an epiphany that resulted in my announcement to some of my trader friends that I was back and I was ready to regain my confidence and experience much better results. You might say it was a swing back to confidence rather than anything else but there was an obvious thing that caused my block which is why I feel a trader must review past trades Weekly if not Daily to see what went well and why or vice versa when trades are not working. Yes the Market’s were turbulent but regardless of that they were very tradable and almost better than usual as the moves and Volatility provided wide ranges that could have resulted in excellent profits…I wanted to share this in hope that it would help anyone who has or is in a trading slump. Hindsight is a wonderful teacher use it to your benefit. cthelight
DK rules: 1) review trades 2) create a journal, write down reason 3) analyze winners / losers, how stops would/did work, targets 4) always have a set of basic rules.
Three point kick: big picture set up comes into focus based on the Square of 9 and the breakout over a long declining trendline, then there is a ‘3 Point Kick’ that is the action point: 1) The breakout, 2) The backtest, 3) The follow through. The successful backtest in tandem with upside follow through over the 50 day moving average represents a bullish change in character. Jeff Cooper
Trader Joe X Wave: 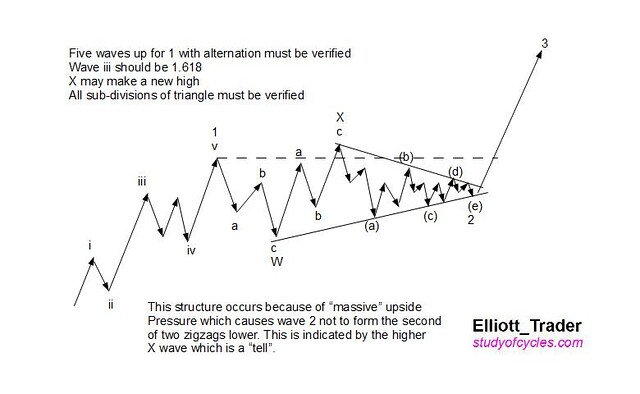
TJ Diagonals: If you see a little “Contracting Leading Diagonal” at the beginning of the wave? That tells you “something very powerful is ahead”. But if you don’t care to learn the five simple patterns, you will never discover the power of the wave following. Diagonals happen because the market is “winding up for the pitch”. It has to “gather energy” to pop! And we all know what follows that wave!
Momentum Investing – price above 250 MA, Relative Strength above 90, Slow Stochastic rising from below 20 to above (money wave). Joanne Kline
Power Earnings Gap (PEG): “a stock that gaps up after reporting strong earnings and closes the day by printing a very strong candle (candle that closes at or near the session highs) is best PEG candidate! Volume will be huge since it’s coming on news of an earnings report. That is going to add greater conviction to the impulse since institutions are piling into the name! Small fish need to follow the foot steps of the Big Fish (Insiders, movers and shakers). They know stuff we could never dream of knowing but luckily for us, we can see their “foot steps” via stock price action and volume patterns. Following these foot prints can be extremely profitable if you know what to look for! Stocks that gap up on huge volume and close near the day’s highs, are doing that for a very good reason: Big Whales want in”. Art of the Chart, TraderStewie
Larry Conner’s trading model: P> 200 DMA, buy close when RSI(2) <5, sell P> 5 DMA.
Gary Smith 1-2-3-4 set up: new high consolidate for three days, buy day four over day three high.
Coppock Curve – designed by the late E.S. Coppock, to identify major lows. The signal he developed was to wait for the indicator to fall below zero and then turn up; other than that, he concluded that the indicator was of little use. M Pring (note: @joefriday_714 and David Larew use the declining slope as a bearish indicator, first impression: appears valid; so why didn’t Coppock do that?)
Price is the tip of the spear – follow price, not indicators. Jeff Cooper
“It is a cardinal principal of stock manipulation to put up a stock in order to sell it.” JL

![]()

“The key to speculation is observation to determine how a market reacts to a possible time/price harmonic” Jeff Cooper Sq Time & Price
“See both sides, opportunity is more easily made up than losses” Todd Harrison
Navy Seal 10 Lessons – Admiral William McRaven
All content for education, not trading advice; do your own due diligence. FD – may have positions in securities mentioned. Blog intended as guide for my boys. Greatest joy in life is being alive to watch your children’s success, thanks guys!
